In today's competitive landscape, simply tracking total sales is like navigating with a broken compass. Multi-location retailers need a granular, data-driven approach to understand what truly drives growth, customer loyalty, and profitability at each individual store. This requires moving beyond surface-level numbers and embracing a holistic set of retail store performance metrics that connect everything from local marketing efforts to inventory efficiency and in-store operations.
For instance, understanding how local online visibility-measured through digital signals like profile clicks, direction requests, and search impressions-directly impacts in-store foot traffic is no longer a 'nice-to-have'; it's a foundational element of a modern retail strategy. This guide breaks down the 10 most essential metrics every retailer must master to thrive.
We will provide a prioritized, actionable roundup, defining each metric and explaining why it matters for multi-location businesses. For each of the 10 key performance indicators, we will detail:
- How to measure it, including specific formulas and data sources.
- Target benchmarks to aim for in your industry.
- Actionable strategies to improve performance, with practical examples.
- How local digital signals feed into and influence these core business KPIs.
This comprehensive list will equip you with the knowledge to move beyond basic sales figures, allowing you to diagnose issues, identify opportunities, and ensure every single one of your locations performs at its peak potential. We'll skip the generic advice and give you the specific tools needed to make smarter, data-backed decisions for your retail business.
1. Same-Store Sales Growth (Comparable Sales)
Same-store sales growth, often called comparable sales or "comp sales," is one of the most vital retail store performance metrics. It measures revenue growth exclusively from stores that have been open for at least one year, comparing performance across identical time periods (e.g., this quarter versus the same quarter last year).
This metric is crucial because it isolates organic growth from expansion-related revenue. By excluding the sales impact of newly opened or recently closed stores, you get an honest assessment of how your existing locations are performing. This helps you understand if your core business is truly strengthening.
How to Measure and Benchmark Same-Store Sales
The formula provides a clear, apples-to-apples comparison of your established stores' health.
- Formula:
(Current Period Sales - Prior Period Sales) / Prior Period Sales * 100 - Data Sources: Point-of-Sale (POS) system data, financial statements.
- Benchmark: Healthy retailers typically aim for a positive comp sales growth of 2-5% annually, though this varies by industry. Consistent negative growth is a significant red flag.
For example, a regional coffee chain with 20 established cafes generated $5 million in sales in Q3 last year and $5.2 million in Q3 this year. Their same-store sales growth would be ($5.2M - $5.0M) / $5.0M * 100 = 4%.
Actionable Strategies to Improve Comp Sales
Improving same-store sales requires a focus on increasing either transaction volume or average transaction value at existing locations.
-
Boost Local Discovery: Your existing stores' growth is directly tied to their visibility in local search. An increase in "near me" searches, Google Maps profile clicks, and direction requests (local signals) often precedes a rise in foot traffic and sales. Investing in a robust local marketing strategy is essential for driving qualified customers to your established stores. Discover how to enhance your local marketing strategy on nearfront.com.
-
Segment and Analyze: Don't just look at the aggregate number. Segment comp sales by region, store format, or even by day of the week to pinpoint specific areas of underperformance or opportunity.
-
Enhance In-Store Experience: Use customer feedback and sales data to optimize store layout, train staff on upselling techniques, and introduce loyalty programs that encourage repeat visits and larger basket sizes.
2. Inventory Turnover Ratio
Inventory turnover is a critical retail store performance metric that measures how many times a company sells and replaces its inventory over a specific period. It reveals how efficiently you are managing stock, converting it into sales, and minimizing capital tied up in unsold goods.
A high turnover ratio generally indicates strong sales and effective inventory management, while a low ratio can signal overstocking, obsolete products, or weak demand. By tracking this metric, retailers can make smarter purchasing decisions, reduce holding costs, and improve overall cash flow. It's a direct measure of your operational efficiency and product-market fit.
How to Measure and Benchmark Inventory Turnover
The formula shows how quickly your company is converting its inventory into revenue, making it a powerful gauge of business health.
- Formula:
Cost of Goods Sold (COGS) / Average Inventory - Data Sources: Inventory management system, accounting records (balance sheet and income statement).
- Benchmark: This varies significantly by industry. Fast-fashion retailers like Zara may aim for 12+ turns annually, while grocery chains often see 8-10 turns for fresh goods. A specialty electronics store might have a lower target due to higher-cost items.
For example, if a wellness brand has a COGS of $400,000 for the year and its average inventory value was $50,000, its inventory turnover ratio would be $400,000 / $50,000 = 8. This means the brand sold and replaced its entire inventory eight times during the year.
Actionable Strategies to Improve Inventory Turnover
Improving this ratio involves either increasing sales velocity or reducing the amount of inventory on hand without causing stockouts.
-
Forecast Demand with Local Signals: Inventory needs are driven by local demand. By analyzing local search trends, Google Maps interactions, and direction requests for specific products or categories, you can better predict what customers in a particular area want. This allows you to stock the right products at the right locations, boosting sales and preventing dead stock.
-
Set Category-Specific Targets: Avoid a one-size-fits-all approach. High-demand, low-margin items should turn over much faster than high-margin, slower-moving specialty goods. Analyze turnover by product category to identify specific opportunities for improvement.
-
Implement an Aging Inventory Policy: Actively monitor inventory aging reports to identify slow-moving or obsolete stock. Implement a clear strategy for marking down and clearing out this "dead stock" before it becomes a significant financial drain on your business.
3. Gross Profit Margin
Gross profit margin is a fundamental profitability metric that measures the percentage of revenue remaining after accounting for the cost of goods sold (COGS). It directly reflects how efficiently a retailer converts inventory into profit before considering operational expenses like rent, labor, and marketing.
This metric is critical for assessing the core health of your product strategy. A strong gross margin indicates effective pricing, favorable supplier terms, and a desirable product mix. It provides the necessary funds to cover operating costs and ultimately generate net profit, making it a key indicator of your business's financial viability.
How to Measure and Benchmark Gross Profit Margin
The formula reveals the profitability of your products themselves, separate from other business expenses.
- Formula:
(Total Revenue - Cost of Goods Sold) / Total Revenue * 100 - Data Sources: Point-of-Sale (POS) system, inventory management software, accounting records.
- Benchmark: This varies significantly by retail segment. Luxury brands like Saks Fifth Avenue often see margins of 40-50%, while discount retailers like Walmart operate on thinner margins of 20-25%. A sporting goods store like Dick's Sporting Goods typically falls in the 30-35% range.
For example, a wellness studio sells $50,000 worth of private-label supplements in a quarter, and the cost to acquire those supplements (COGS) was $30,000. Their gross profit margin would be ($50,000 - $30,000) / $50,000 * 100 = 40%.
Actionable Strategies to Improve Gross Profit Margin
Improving gross margin involves strategic adjustments to pricing, procurement, and product assortment to maximize the profitability of each sale.
-
Optimize Product Mix and Pricing: Analyze margin performance by product category, supplier, and even individual store. Prioritize high-margin items in merchandising and promotional efforts. Use this data to strategically adjust prices on items with low price elasticity while ensuring you remain competitive on key products.
-
Negotiate Better Supplier Terms: Use sales volume and performance data as leverage to negotiate lower costs, volume discounts, or better payment terms with your suppliers. A small reduction in COGS can have a significant impact on your overall margin.
-
Introduce Private-Label Products: Develop and promote your own branded products. Private-label goods typically offer much higher margins than their national brand counterparts, giving you greater control over pricing and profitability while building brand loyalty.
4. Customer Acquisition Cost (CAC)
Customer Acquisition Cost (CAC) is a critical retail store performance metric that calculates the total cost to acquire a single new customer. It encompasses all marketing and sales expenses incurred during a specific period, divided by the number of new customers gained within that same timeframe.
Understanding your CAC is essential for evaluating the efficiency and return on investment (ROI) of your marketing efforts. A high CAC might indicate inefficient spending, while a low CAC suggests your acquisition strategies are effective. For multi-location retailers, tracking CAC helps allocate marketing budgets to the most profitable channels and locations.
How to Measure and Benchmark CAC
The formula provides a clear picture of how much it costs to bring a new customer through your doors, whether physically or digitally.
- Formula:
(Total Marketing & Sales Costs) / (Number of New Customers Acquired) - Data Sources: Marketing campaign reports (e.g., Google Ads, social media analytics), CRM data, POS systems, loyalty program data.
- Benchmark: A "good" CAC is highly dependent on your industry and Customer Lifetime Value (CLV). A general rule of thumb is to aim for a CLV-to-CAC ratio of at least 3:1, meaning a customer’s value is three times the cost to acquire them.
For instance, if a wellness studio spends $10,000 on local marketing in a quarter and acquires 200 new members, its CAC is $10,000 / 200 = $50 per new customer.
Actionable Strategies to Improve CAC
Lowering CAC means acquiring customers more efficiently, directly boosting your profitability.
-
Optimize for High-Intent Local Searches: New customers often start their journey online with searches like "dispensary near me" or "yoga studio in [City]." By improving your local SEO, you increase visibility to these high-intent searchers. A rise in local signals like Google Maps profile clicks and direction requests often correlates with a lower cost per in-store acquisition, as organic traffic is more cost-effective than paid ads.
-
Leverage Referral and Loyalty Programs: Encourage word-of-mouth marketing by rewarding existing customers for bringing in new ones. Sephora's Beauty Insider program, for example, excels at this by offering points and perks that incentivize referrals, effectively lowering the average cost to acquire new shoppers.
-
Analyze Channel-Specific CAC: Don't rely on a blended CAC. Calculate the cost for each marketing channel (e.g., social media ads, local event sponsorships, Google Ads). This allows you to reallocate your budget from high-cost, low-performing channels to more efficient ones, thereby reducing your overall CAC.
5. Customer Lifetime Value (CLV)
Customer Lifetime Value (CLV) is a forward-looking metric that predicts the total net profit a business can expect from a single customer throughout their entire relationship. It moves beyond single-transaction analysis to measure the long-term health and sustainability of your customer base, making it one of the most strategic retail store performance metrics.
This metric is vital because it shifts focus from short-term sales to long-term relationship building. By understanding how much a customer is worth over time, retailers can make smarter decisions about marketing spend, customer service investments, and retention strategies. A high CLV indicates strong customer loyalty and a profitable business model.
How to Measure and Benchmark CLV
Calculating CLV helps you understand the return on your customer acquisition and retention efforts, ensuring you invest wisely.
- Formula:
(Average Purchase Value * Purchase Frequency) * Customer Lifespan - Data Sources: Point-of-Sale (POS) system data, Customer Relationship Management (CRM) software, loyalty program data.
- Benchmark: The ideal benchmark is a CLV-to-Customer Acquisition Cost (CAC) ratio of at least 3:1. This means a customer's lifetime value is three times the cost of acquiring them. For instance, Starbucks rewards members often have a CLV 2-3 times higher than non-members.
For example, a customer at a local wellness studio spends an average of $80 per visit, comes in 6 times a year, and remains a customer for 3 years. Their CLV would be ($80 * 6) * 3 = $1,440.
Actionable Strategies to Improve CLV
Boosting CLV hinges on increasing purchase frequency, average order value, and customer retention.
-
Personalize the Local Journey: Customers who feel a strong connection to a local store are more likely to return. Use local signals like frequent direction requests or profile clicks to identify engaged local customers. Target them with personalized offers, event invitations, or loyalty perks specific to their preferred location, strengthening their bond and increasing their visit frequency.
-
Segment and Cultivate: Don't treat all customers the same. Segment your customer base by CLV to identify your most valuable patrons. Develop exclusive loyalty tiers or personalized communication for this top segment to nurture their long-term value and prevent churn.
-
Optimize Post-Purchase Engagement: The relationship doesn't end at the sale. Implement automated email or SMS campaigns that offer complementary product recommendations, solicit feedback, or provide value-added content. This keeps your brand top-of-mind and encourages the next purchase, directly extending customer lifespan.
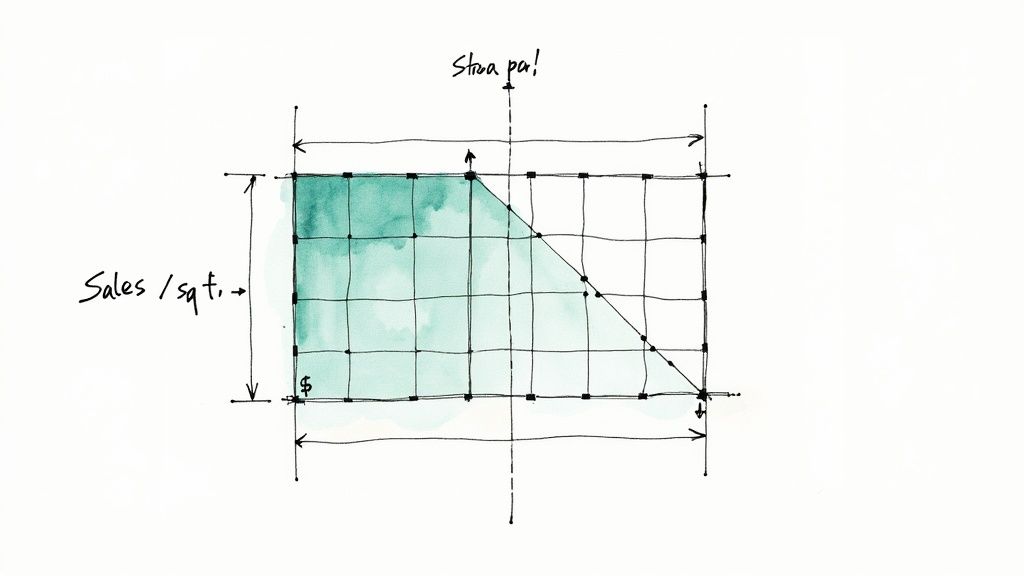
6. Sales Per Square Foot
Sales Per Square Foot (SPSF) is a powerful retail store performance metric that measures a store's financial productivity in relation to its physical size. It reveals how efficiently a retailer is using its sales floor to generate revenue, making it a critical indicator of store layout effectiveness, merchandising strategies, and overall location health.
This metric is essential for comparing the performance of different-sized stores on a level playing field. A large store might have higher total sales, but a smaller, more efficient store could have a much higher SPSF, indicating better space utilization. This insight is crucial for real estate decisions, store design, and inventory management.
How to Measure and Benchmark Sales Per Square Foot
Calculating SPSF provides a standardized measure of store productivity, allowing for direct comparison across your entire portfolio.
- Formula:
Total Net Sales / Total Square Footage of Selling Space - Data Sources: Point-of-Sale (POS) system data, lease agreements or store floor plans.
- Benchmark: This varies dramatically by industry. For example, luxury retailers like Tiffany & Co. can exceed $3,000, while grocery stores might average around $600-$800. The key is to benchmark against direct competitors and your own historical data.
If a 3,000-square-foot boutique generates $1.5 million in annual net sales, its SPSF is $1,500,000 / 3,000 sq ft = $500. This figure helps evaluate its performance against other locations and industry standards.
Actionable Strategies to Improve Sales Per Square Foot
Improving SPSF involves making every square foot of your selling space work harder, either by increasing traffic or encouraging higher spending within that space.
-
Optimize Store Layout and Flow: Analyze foot traffic patterns to place high-demand products in prominent, high-traffic areas. Use planograms to ensure your merchandising strategy maximizes visibility for key items, which can be informed by what local customers are searching for online before they visit.
-
Analyze Department-Level Performance: Don't just calculate SPSF for the entire store. Break it down by department or category. This can reveal which product lines are overperforming and which are underutilizing valuable floor space, guiding decisions on inventory allocation and layout adjustments.
-
Drive High-Intent Foot Traffic: A higher SPSF starts with getting more qualified buyers through the door. By improving your store's visibility in local search for specific products ("running shoes near me"), you attract customers with a clear purchase intent. This translates to a higher likelihood of conversion and a direct boost to your revenue generated per square foot.
7. Conversion Rate
Conversion rate is a fundamental retail store performance metric that measures the percentage of visitors who make a purchase. It directly assesses the effectiveness of your in-store experience, from layout and merchandising to the performance of your sales associates. A high conversion rate indicates you are successfully turning foot traffic into paying customers.
This metric is critical because it bridges the gap between attracting visitors and generating revenue. While high foot traffic is great, it means little if those visitors don't buy anything. Tracking conversion rate helps you understand how well you are capitalizing on the opportunities that walk through your door each day.
How to Measure and Benchmark Conversion Rate
Calculating this metric reveals how efficiently your store environment and staff convert interest into sales.
- Formula:
(Total Transactions / Total Store Visitors) * 100 - Data Sources: POS system data (for transactions) and foot traffic counters (for visitors).
- Benchmark: Benchmarks vary significantly by retail segment. Specialty stores often see 15-25% conversion, while luxury boutiques can reach 20-30%. Department stores typically average a lower 8-12%.
For example, if a wellness studio had 800 visitors in a week and its POS system recorded 160 transactions, its conversion rate would be (160 / 800) * 100 = 20%.
Actionable Strategies to Improve Conversion Rate
Improving conversion rate requires optimizing the path from store entry to checkout, ensuring every touchpoint encourages a purchase.
-
Attract High-Intent Customers: Your conversion rate starts before a customer even enters. A well-optimized online presence attracts qualified local searchers who are actively looking to buy. Ensuring your hours, services, and inventory are accurate on your digital storefront leads to higher-quality foot traffic that is more likely to convert. Learn how to optimize your Google Business Profile to attract these ready-to-buy customers.
-
Segment and Analyze Performance: Don't rely on a single, store-wide conversion rate. Analyze it by department, time of day, or specific sales associate to identify strengths and weaknesses. This data can pinpoint where additional staff training or merchandising adjustments are most needed.
-
Invest in Staff Training: Empower your sales team with consultative selling skills. Training them to understand customer needs, demonstrate product value, and effectively handle objections can dramatically increase the likelihood of a purchase and boost overall conversion rates.
8. Average Transaction Value (ATV)
Average Transaction Value (ATV), sometimes called Average Order Value (AOV), measures the average amount a customer spends in a single transaction. It’s a core metric that provides direct insight into customer purchasing behavior, the effectiveness of your pricing strategy, and your sales team's ability to upsell and cross-sell.
While metrics like foot traffic measure how many people come in, ATV tells you the quality of those visits. A rising ATV indicates that customers are finding more value in each visit, which is a powerful lever for boosting revenue without needing to increase foot traffic. It's one of the most direct retail store performance metrics for evaluating in-store sales tactics.
How to Measure and Benchmark ATV
Calculating ATV is straightforward, providing a clear snapshot of how much customers are willing to spend per visit at your locations.
- Formula:
Total Revenue / Number of Transactions - Data Sources: Point-of-Sale (POS) system reports, e-commerce platform analytics.
- Benchmark: ATV varies dramatically by industry. A specialty coffee shop might have an ATV of $5-$10, while a fast-fashion retailer like H&M aims for $30-$50. Luxury brands can see ATV well into the hundreds or thousands.
For example, if a cannabis dispensary generated $15,000 in revenue from 250 separate transactions in one day, its ATV would be $15,000 / 250 = $60.
Actionable Strategies to Improve ATV
Increasing ATV is about encouraging customers to add more items to their basket or purchase higher-margin products during their visit.
-
Implement Strategic Bundling: Analyze your sales data to identify frequently co-purchased items using basket analysis. Create compelling product bundles or "buy one, get one" offers that provide clear value and encourage a larger purchase than originally intended.
-
Train Staff on Upselling and Cross-Selling: Equip your sales associates with the knowledge and techniques to effectively suggest complementary products or premium alternatives. For example, a wellness studio employee could recommend a high-margin nutritional supplement to a customer after their class.
-
Optimize Store Layout and Product Placement: Position high-margin impulse-buy items near the checkout counter. Use strategic merchandising to place related products next to each other, making it easy for customers to see how items work together and encouraging them to add more to their cart.
9. Employee Productivity (Sales Per Employee)
Employee productivity, often measured as sales per employee, is a core retail store performance metric that assesses the efficiency of your labor force. It calculates the amount of revenue generated for each employee, providing a direct link between staffing levels and sales output.
This metric is essential for optimizing labor costs, which are typically one of the largest operating expenses for a retailer. By understanding how productive your team is, you can make informed decisions about scheduling, training, and staffing levels to maximize profitability without compromising the customer experience. It helps identify top-performing stores and teams that can serve as models for the rest of the organization.
How to Measure and Benchmark Employee Productivity
The formula offers a clear view of your labor efficiency, but it's crucial to use full-time equivalents (FTEs) to account for part-time staff accurately.
- Formula:
Total Sales / Total Number of Full-Time Equivalent (FTE) Employees - Data Sources: Point-of-Sale (POS) system data, payroll and HR records.
- Benchmark: This varies significantly by industry. For example, grocery stores might target $200,000-$300,000 per employee, while fast-fashion retailers like Zara aim for $120,000-$180,000. Tech retailers often fall in the $150,000-$200,000 range.
For instance, a wellness studio with 4 FTEs generated $800,000 in annual sales. Their sales per employee would be $800,000 / 4 = $200,000.
Actionable Strategies to Improve Employee Productivity
Improving this metric involves empowering your staff to be more effective and ensuring stores have consistent customer traffic to engage.
-
Drive Consistent Foot Traffic: An employee cannot generate sales without customers. Investing in local marketing to increase local signals like "near me" searches, Google Maps profile clicks, and direction requests ensures a steady flow of shoppers for your team to serve, directly boosting their sales potential. Explore how to build a winning local marketing strategy on nearfront.com.
-
Invest in Product and Sales Training: A well-trained employee is more confident and effective at upselling, cross-selling, and closing sales. Regular training on product knowledge, customer service excellence, and sales techniques is one of the most direct ways to increase the value of each customer interaction.
-
Optimize Staffing and Scheduling: Use store traffic data to align staffing schedules with peak shopping hours. This prevents overstaffing during slow periods and understaffing during rushes, ensuring your labor investment is always directed toward the greatest sales opportunity. Monitor for signs of burnout if productivity goals create excessive workloads.
10. Customer Retention Rate
Customer Retention Rate (CRR) measures the percentage of existing customers who continue to do business with you over a specific period. While acquisition metrics are exciting, retention is the foundation of sustainable profitability. It costs significantly more to acquire a new customer than to retain an existing one, making CRR a critical indicator of long-term health.
This metric reveals the effectiveness of your loyalty initiatives, customer service, and overall brand experience. A high retention rate signifies a strong, loyal customer base that provides a reliable revenue stream, is more likely to try new products, and acts as a powerful source of word-of-mouth marketing. It's a direct reflection of how well you're building lasting relationships.
How to Measure and Benchmark Customer Retention Rate
Tracking this metric helps you understand the stability of your customer base and the return on your customer experience investments.
- Formula:
((Ending Customers - New Customers) / Beginning Customers) * 100 - Data Sources: CRM system, loyalty program data, POS transaction history.
- Benchmark: While benchmarks vary, top-tier loyalty programs like Amazon Prime see 90%+ annual retention. For general retail, a rate of 40-50% is common, with strong loyalty programs pushing that to 60% or higher.
For instance, a boutique chain starts the year with 5,000 active customers. They acquire 1,000 new customers and end the year with 4,500 total active customers. Their CRR would be ((4,500 - 1,000) / 5,000) * 100 = 70%.
Actionable Strategies to Improve Customer Retention
Improving retention involves consistently delivering value and a positive experience that encourages customers to return.
-
Develop a Robust Loyalty Program: Reward repeat business with exclusive discounts, points, or early access to new products. Tailor rewards based on purchasing behavior to make customers feel valued and understood.
-
Systematize Customer Feedback and Reviews: Actively solicit feedback to understand why customers stay or leave. Positive reviews build social proof that reinforces a customer's decision to return, while negative feedback provides a direct roadmap for improvement. Discover how to get more Google reviews compliantly on nearfront.com.
-
Segment and Personalize Communication: Don't treat all customers the same. Use purchase history and engagement data to segment your audience and send personalized offers, content, and reminders that are genuinely relevant to their needs and interests.
Top 10 Retail Store KPI Comparison
| Metric | 🔄 Implementation complexity | ⚡ Resource requirements | 📊 Expected outcomes | Ideal use cases | ⭐ Key advantage |
|---|---|---|---|---|---|
| Same-Store Sales Growth (Comparable Sales) | Medium — requires store-level period matching and seasonality adjustments | Moderate — POS data by store, time-series tools | Clear measure of organic revenue trends excluding expansion | Mature multi-store retailers; investor reporting | Isolates organic growth and operational momentum ⭐⭐⭐⭐ |
| Inventory Turnover Ratio | Low–Medium — simple formula but needs accurate COGS & avg. inventory | Moderate — accounting data, category-level tracking systems | Efficiency of stock movement; identifies slow/obsolete SKU risk | Merchandisers, inventory planners, fast-moving consumer goods | Reveals inventory efficiency and cash‑flow impact ⭐⭐⭐⭐ |
| Gross Profit Margin | Low — straightforward percentage calculation (Revenue vs COGS) | Low — revenue and COGS by product/category | Indicates pricing power and product mix profitability | Pricing strategy, category management, supplier negotiations | Direct indicator of margin strength and pricing effectiveness ⭐⭐⭐⭐ |
| Customer Acquisition Cost (CAC) | Medium — requires channel attribution and cost allocation | Moderate–High — marketing spend tracking, attribution tools | Cost per new customer; basis for ROI and payback analysis | Marketing optimization, channel testing, startups scaling | Measures acquisition efficiency; pairs with CLV for ROI ⭐⭐⭐ |
| Customer Lifetime Value (CLV) | High — predictive modeling with assumptions and segmentation | High — historical CRM data, analytics capability | Long-term revenue per customer; guides retention investment | Loyalty programs, subscription businesses, segmentation strategy | Guides sustainable acquisition vs retention spend; strategic value ⭐⭐⭐⭐ |
| Sales Per Square Foot | Low — simple division but needs consistent floor area definitions | Low–Moderate — sales & store footprint data | Productivity of physical space; site performance comparison | Real estate planning, store optimization, expansion decisions | Quantifies space productivity for real-estate decisions ⭐⭐⭐ |
| Conversion Rate | Medium — requires accurate traffic counting and transaction matching | Moderate — footfall counters or analytics + POS integration | Effectiveness of merchandising/staff in converting visitors | Store layout optimization, sales training, merchandising tests | Direct measure of sales effectiveness; actionable for improvements ⭐⭐⭐ |
| Average Transaction Value (ATV) | Low — simple average calculation from POS data | Low — POS sales and transaction counts | Average spend per purchase; indicates upsell/cross‑sell success | Promotions, bundling strategies, staff targets | Highlights selling effectiveness and bundling opportunities ⭐⭐⭐ |
| Employee Productivity (Sales per Employee) | Medium — requires normalized FTE calculations and period alignment | Low–Moderate — payroll/headcount and sales data | Labor efficiency and staffing benchmarks | Staffing strategy, productivity targets, incentive design | Guides staffing and productivity improvements ⭐⭐⭐ |
| Customer Retention Rate | Medium–High — needs unified customer IDs and cohort tracking | High — CRM, cross-channel tracking, cohort analysis tools | Loyalty and sustainability of customer base; churn indicator | Loyalty programs, retention campaigns, subscription services | Low-cost growth driver; early warning on churn ⭐⭐⭐⭐ |
| (Overall) Tip for Use | — | — | — | — | 💡 Use metrics in combination (e.g., CAC vs CLV, ATV+Conversion) for balanced decisions |
From Metrics to Momentum: Turning Data into Action
You now have a comprehensive toolkit of ten essential retail store performance metrics that serve as the vital signs for your multi-location business. From the high-level financial health indicated by Same-Store Sales Growth and Gross Profit Margin to the operational efficiency measured by Inventory Turnover and Sales Per Square Foot, each KPI tells a crucial part of your story. We've explored how to measure them, what benchmarks to aim for, and, most importantly, how to take decisive action to improve them.
The true power of these metrics, however, is not found in isolation. A high Conversion Rate is fantastic, but its impact is limited by a low Average Transaction Value. Similarly, an impressive Customer Lifetime Value (CLV) can be completely negated by an unsustainable Customer Acquisition Cost (CAC). The real breakthrough comes when you stop viewing these as individual data points on a spreadsheet and start weaving them together into a holistic performance narrative.
Building a Cohesive Performance Strategy
Think of these metrics as interconnected gears in a complex machine. When one gear turns, it affects all the others. Your goal is to understand these relationships and optimize the entire system, not just one component.
- Diagnose with Precision: By analyzing metrics in concert, you can pinpoint the root cause of a problem. Is low Sales Per Square Foot a product of poor layout, or is it a symptom of low foot traffic, which points back to a weak local marketing strategy?
- Connect Digital Efforts to In-Store Results: The journey from an online search to an in-store purchase is no longer a mystery. Digital signals, such as local search impressions, profile clicks, and direction requests, are direct leading indicators for in-store foot traffic and, consequently, conversion rates and sales. Recognizing this connection allows you to directly attribute marketing spend to store revenue.
- Empower Your Teams: When store managers and employees understand metrics like Sales Per Employee and ATV, they are no longer just executing tasks. They become active participants in the store's success, equipped to make smarter decisions on the fly, from upselling strategies to customer service interactions.
Key Takeaway: The most successful multi-location retailers don't just track metrics; they operationalize them. They build a culture of data-driven decision-making that permeates every level of the organization, from the C-suite to the sales floor. This transforms performance measurement from a reactive reporting exercise into a proactive engine for growth.
Your Actionable Path Forward
Mastering your retail store performance metrics is an ongoing process of measurement, analysis, action, and refinement. It’s not about achieving a perfect score but about continuous, incremental improvement that compounds over time. Use this guide as your roadmap. Start by establishing your baseline for each of the ten KPIs across all your locations. Identify the outliers, both positive and negative, and dig deeper to understand the "why" behind the numbers.
Implement one or two new strategies based on your findings, whether it’s a staff training initiative to boost ATV or a local SEO campaign to increase foot traffic. Then, measure again. This iterative cycle is the engine of sustainable profitability and market leadership. By embracing this data-centric approach, you move beyond simply managing your stores to actively engineering their success, turning raw numbers into real-world momentum and a tangible competitive advantage.
Ready to connect your local digital presence directly to your in-store performance? Nearfront provides the critical data on local searches, profile clicks, and direction requests that fuel your most important retail KPIs. See exactly how your online visibility drives offline revenue and start making smarter marketing decisions today. Visit Nearfront to learn more.